9.9. Development Tools
The Data Ingestion Engine contains a number of tools to assist the development and troubleshooting of a pipeline, by verifying the correct structure and operation of that pipeline. These tools can be divided in two classes:
- Static inspection
These tools can be used to verify the correct syntax and structure of the pipeline, without the need to execute the pipeline:
- Execution inspection
These tools can be used to verify the correct execution of the pipeline on actual data:
9.9.1. Component verification
Every time a component is saved, its option values are verified. Possible issues are:
- required options that are not filled in.
- illegal option values (for example a class name containing a space).
- data sources files in import components that are missing.
- expressions containing errors.
- expressions with failing Unit tests.
- conflicting options.
Moreover, every time a component is saved or opened, it is checked whether classes, predicates and data sources used/required by a component effectively exist at that point in the pipeline, i.e. whether they have been created by an ancestor component.
Components with errors are shown with a red triangle in the pipeline graph view.
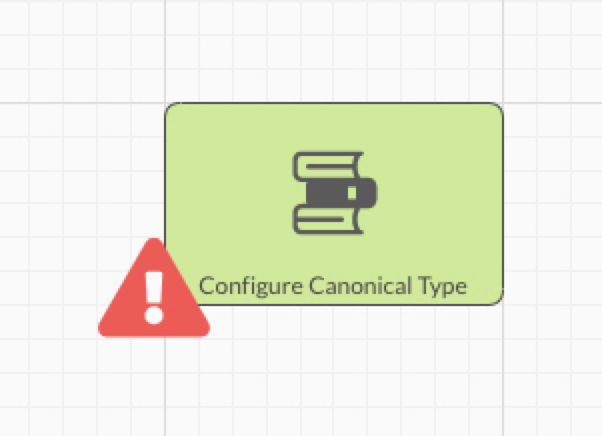
Figure 9.100 component with a verification error indicated on the pipeline view.
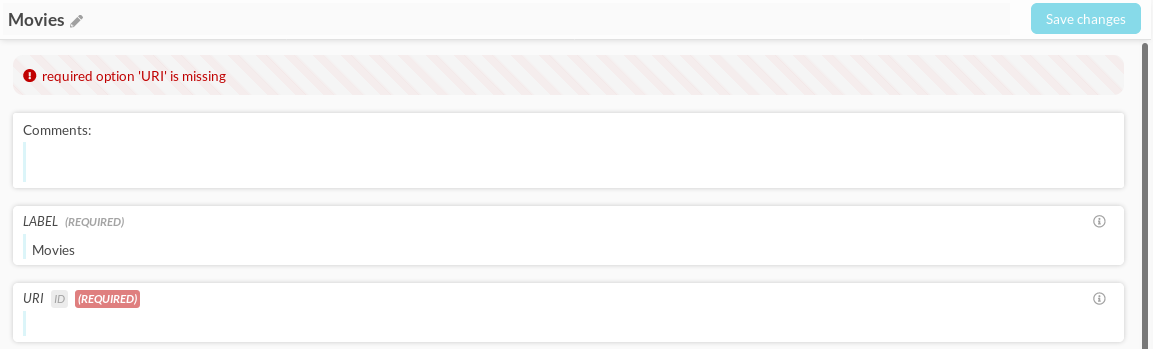
Figure 9.101 Verification error indicated when a component is opened.
Components with verification errors can also be searched for by switching on “Has verification error” in the component filter menu.
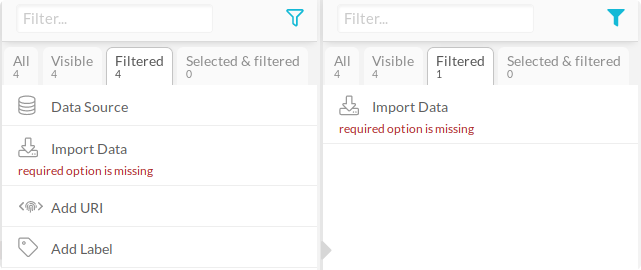
Figure 9.102 The component filter menu with the option “Has verification error” switched off (left) and switched on (right).
9.9.2. Pipeline verification
Full static inspection of a pipeline is initiated by clicking on the  symbol in the top-right corner of the graph viewer. For large and complex pipelines, this
process can take a while to complete.
symbol in the top-right corner of the graph viewer. For large and complex pipelines, this
process can take a while to complete.
Static inspection verifies for each component whether classes, predicates and data sources that it needs are present, as described above.
Moreover, the verification also gives warnings if parallel paths problems are detected. A parallel path warning is issued if:
a component A writes (or changes) a predicate Pand another component B reads that predicate Pand A and B are parallel, i.e. neither is an ancestor of the other.
The problem with parallel components is that their order of execution is arbitrary. This means that component B may be executed before or after component A, so the value of predicate P is unsure. These kinds of problems should be remedied by adding appropriate links in the pipeline graph which impose a non-arbitrary execution order, e.g. making A a predecessor of B or vice versa.
Note that the warning can be shown either in component A or in component B.
9.9.3. Lineage Analysis
Static inspection of the pipeline (initiated by clicking on the
symbol) also allows one to trace how information flows through the pipelines. This can be done in two directions:
Impact analysis (forward) and Dependency analysis (reverse).
Impact analysis
Starting a component that imports data,
it is possible to trace how the data assets that are imported by that component
(for example the COLUMNS option of a Import CSV)
impact other components and data throughout the pipeline, ending with
facets and properties configured for publishing in DISQOVER in a Configure Canonical Type.
This report can be created using the  button.

Figure 9.103 Example of an impact analysis report.
Dependency analysis
From a Configure Canonical Type component,
a reverse analysis can be performed for FACETS and PROPERTIES,
tracing how these data assets that are published in DISQOVER are dependent on
upstream data and component, back to the level of components importing source data.
This report can be created using the  button.

Figure 9.104 Example of a dependency analysis report.
9.9.4. Counters and statistics
While a component executes, it accumulates statistical information about the data it processes. This information is presented in the component view on the right-hand side, either in the section Counters or in the section Predicate Statistics.
Counters contains information about the number of resources read, e.g.:
Target Class: number of resources after filtering: 127881
and, in case of linking or merging components, about the number of matches, e.g.:
Number of (unique) identifiers without match: 315
Predicate Statistics contains information about the predicate values produced by this component, per predicate.
For example, an import component will list all produced predicates.
Recall that all predicates are multi-valued. If a predicate already existed prior to execution of a component, that component can only add values to the predicate. It is very important to note that the statistics in Predicate Statistics only apply to the values added to a predicate by this component, not to the complete predicate! Of course, if the component created a predicate, then the statistics apply to the complete predicate.
For each predicate three numbers are shown:
- defined count: the number of resources for which this component added one or more values.
- multivalued count: the number of resources for which this component added more than one value.
- distinct count: the number of distinct values added by this component.
Important: for performance reasons, the distinct count number is capped to 1000. If the component produces more than a thousand distinct values, then the value will be 1000.
An example, with a component that adds to an existing predicate predicate1 and adds a new predicate predicate2:
Class before execution:
predicate1.lit [“a”, “b”] [“g”] []
Class after execution (new values, notated in bold):
predicate1.lit predicate2.lit [“a”, “b”] [] [“g”, “h”] [“1”] [“x”, “y”] [“1”, “2”]
Predicate statistics would then be:
distinctCount definedCount multivaluedCount predicate1.lit 3 2 1 predicate2.lit 2 2 1
Note that counters and statistics shown in the component feedback always correspond to the last execution of that component. If the component options changed since that last execution, the message ‘Component was updated since last run’ is shown in the component feedback.
9.9.5. Execution errors and warnings
A component may encounter problems during its execution. Problems are categorized as execution warnings or execution errors.
Note that these are not the same as the static verification errors and warnings which are described above.
Warnings and errors are shown in the component view on the right hand side. They are also be reported in the Data Ingestion Report.
If an error occurs during execution of a component, the component will stop executing. However, it will not stop execution of the rest of the pipeline.
The final component Publish in DISQOVER is a special case.
If any error occurred in any component, it will not be executed,
unless this is specifically requested by the user via the option Allow publishing in case of errors
in the Debugging execution tab of the Execute pipeline form.
Warnings are less severe than errors. After reporting the warning, if possible, a component will proceed to execute.
Some warnings are simple warnings, which can only occur once. Other warnings can occur multiple times, typically for every resource. In such a case the total number of warnings (of that particular type) is reported, as well as a limited number of examples.
If a warning pertains to a particular resource, then the warning will include a resource ID of the form
0080_00000003:123. Clicking on the resource ID opens the Find Resources form (see Data inspection tools).
An example from the Transform Literals component:
Warnings
  Error while processing a resource.
    Count: 8776
    - 0080_00000000:12: Error while evaluating function 'ListTranspose' Inconsistent list lengths for ...
    - 0080_00000000:14: Error while evaluating function 'ListTranspose' Inconsistent list lengths for ...
    ...
In the pipeline graph view, it is possible to show which components have execution errors or warnings. To do this, select Execution Status as the value for the menu-item Color overlay in the pipeline menu. Components are then colored
- Red if it has an execution error.
- Orange if it has an execution warning.
- Green if it executed successfully.
- Gray if it was not executed (yet).
Note that execution errors and warnings shown in the component feedback always correspond to the last execution of that component. If the component options changed since that last execution, the message ‘Component was updated since last run’ is shown in the component feedback.
Warning suppression
For most kinds of warnings it is possible to convert the warning to an info-message if the number of occurrences is lower than some threshold, using special options of the form “MINIMAL COUNT FOR WARNING …” in the bottom section of the component.
For example, suppose a Transform Literals component gives the warning “Error while processing a resource” for 17 resources, and you give the option ‘MINIMAL COUNT FOR WARNING “ERROR WHILE PROCESSING A RESOURCE.”’ the value 20, then the warning will be shown as an info-message.
Info-messages are shown in the component feedback but not in the Run Report. If Color overlay is ‘Execution Status’, components with info-messages (and no warnings or errors) are shown in green.
9.9.6. Debugging execution
In debugging mode the user can choose whether the component will be executed
via the checkboxes Publish in DISQOVER and Allow publishing in case of errors.
Partial pipeline execution
If a user changes an option value in a component (and saves the changes), that component is outdated (or dirty). This is shown as ‘Component was updated since last run’ in the component feedback.
Changing a component likely also affects all subsequent components (its indirect successors).
The Define Datasource component is a special case: it can become outdated through an external cause, namely its :opt’info file (containing modification dates) being changed. For more details refer to the component description.
By default executing the pipeline will execute all outdated component and all their (indirect) successors.
The user may request a full rerun via the check-box Execute up-to-date components.
Subset parameter
The Data Ingestion Engine is designed to work with very large data files. Depending on the amount of data and the complexity of the pipeline, executing a full pipeline can take a long time (in the order of days).
In order to save some time, the user may wish to execute the pipeline on a subset of the source data, e.g. to verify that the pipeline doesn’t contain errors. This could be achieved by configuring the importers to read from a special set of smaller data files, but that is cumbersome.
A better way to do this is via the subset parameter, available in the Pipeline Execution form (under Debugging).
This is a number between 0 and 1 that determines how many resources are imported.
The default value is 1 (import all resources).
For values lower than 1 a special sampling strategy is used:
- an importer reads a file resource by resource (or instance by instance, or record by record), assigning a resource number 1, 2, 3, … to each resource.
- only those resources are selected (sampled) whose resource number is an element of a truncated geometrical series, the other ones are skipped.
The growth rate of the geometrical series depends on the subset parameter (in a non-linear way).
Note that when using Remote Data Subscription, the Import Remote Data Set components do not take into account the subset parameter.
Two examples:
- for subset parameter = 0.1: select resource numbers 1, 2, 3, 4, 5, 7, 9, 12, 16, 21, 28, 38, 52, 70, 94, …
- for subset parameter = 0.01: select resource numbers 1, 2, 4, 7, 14, 25, 48, 90, …
There are two special cases:
- for subset parameter = 0: select resource numbers 1 (only first resource)
- for subset parameter = 1: select resource numbers 1, 2, 3, 4, 5, … (all resources)
The reduction in number of resources imported is most drastic for very large files, as illustrated in the table below.
Using a geometrical series rather than just the n first records has the benefit of introducing less bias.
An alternative would be to pick every k’th resource, for a well chosen k. But in order to have a drastic reduction for very large files, k would have to be chosen very big, which would completely wipe out small files.
Another advantage of this sampling scheme is that it can be applied without knowing in advance the total number of resources (that would require reading the file twice).
The effect of the subset parameter is illustrated in the following table. The column headers (1, 10, 100, …) show the number of resources in the file. The cells show the number (and fraction) of resources that are effectively imported.
subset parameter |
1 | 100 | 10000 | 1000000 |
|---|---|---|---|---|
| 0.0 | 1 (100.0%) | 1 (1.0%) | 1 (0.0%) | 1 (0.0%) |
| 0.1 | 1 (100.0%) | 15 (15.0%) | 30 (0.3%) | 45 (0.0%) |
| 0.2 | 1 (100.0%) | 30 (30.0%) | 69 (0.7%) | 108 (0.0%) |
| 0.3 | 1 (100.0%) | 57 (57.0%) | 163 (1.6%) | 270 (0.0%) |
| 0.4 | 1 (100.0%) | 93 (93.0%) | 390 (3.9%) | 687 (0.1%) |
| 0.5 | 1 (100.0%) | 100 (100.0%) | 909 (9.1%) | 1745 (0.2%) |
| 0.6 | 1 (100.0%) | 100 (100.0%) | 2035 (20.3%) | 4395 (0.4%) |
| 0.7 | 1 (100.0%) | 100 (100.0%) | 4247 (42.5%) | 10918 (1.1%) |
| 0.8 | 1 (100.0%) | 100 (100.0%) | 7753 (77.5%) | 26618 (2.7%) |
| 0.9 | 1 (100.0%) | 100 (100.0%) | 10000 (100.0%) | 63234 (6.3%) |
| 1.0 | 1 (100.0%) | 100 (100.0%) | 10000 (100.0%) | 1000000 (100.0%) |
Important note: changing the subset parameter will not make the importers outdated. All import components which are scheduled to execute will use the current subset parameter. This means that one can have a mixed situation where some importers were executed with a subset parameter value, and other importers were executed with another subset parameter.
For each Import component the value of the subset parameter used in the last execution is shown in the component feedback.
9.9.7. Data inspection tools
The Data Ingestion Engine offers a few tools to inspect the internal data produced by the pipeline.
It is important to note that these tools inspect the complete data, produced by all components, not by a single component.
Fetch Resource Data
This tool allows the user to see the values of one or more predicates for different resources in a certain class.
The tool can be configured via options:
- Class: the class to be inspected.
- Predicates: the predicates to show.
- Filter (optional): can be used to select a subset of resources. See Filters.
- COMPONENT FILTER: takes a components GUID to only show values added by said component. These GUIDs can be found in the top-right corner of every component (e.g. “34322cfe-bd14-4dc4-a791-e071e5e5dbbb”).
- Include Disabled: if checked, also show the resources that have been disabled (e.g. by Remove Resources or by one of the merge components).
- Limit: the number of resources to show, 100 by default.
Results are presented as a table. Clicking on a resource will show more details.
Enable the switch ‘Include component information’ to show which values where produced by which components (indicated in square brackets next to the values). Clicking on a component tab (above the results table) opens that component.
If you want to change the tool options, click on the title bar ‘Request Form’. After changing the options you can rerun the tool. This behavior is the same for the other inspection tools.
Find URI
This tool allows the user to search resources containing a given subject URI (disq:uri.uri).
- URI: the URI or hashed URI to lookup.
- class (optional): if specified, only search in that class, otherwise search in all classes.
- Predicates: the predicates to show.
- Limit: the number of resources to show, 100 by default.
Results are presented as a table. Clicking on a resource will show more details.
Enable the switch ‘Include component information’ to show contributions by separate components. Enable the switch ‘Include provenance information’ to show contributions by separate provenance.
Technical note: after a successful execution of Publish in DISQOVER a URI-index is constructed behind the screens (this can take some time). Once the URI-index is complete, searching URIs is very fast. If the URI-index is not available, searching URIs is still possible but can be slow.
Find resources
This tool allows the user to find resources by resource ID. A resource ID is an internal identification of a resource, and has the form ‘0000_00000000:0’ (with different numbers). These resource IDs are mentioned in some types of warnings (see Execution errors and warnings). Clicking on the resource ID in the warning will open this action and pre-fill some of the options.
- Resource IDs: One or more resource IDs to lookup.
- Class: the class to search in.
- Predicates: the predicates to show.
Enable the switch ‘Include component information’ to show contributions by separate components.
Calculate predicate statistics
This tool allows the user to get statistics about predicate values.
- Class: the class to inspect.
- Expression returning values: expression which specifies which values to inspect.
- Value Type: the type of the values to inspect. Possible values are string, number, bool or link.
- Max distinct count: the maximum number of distinct values to track (0 is unlimited).
- Max report count: the maximum number of distinct values to actually report (least common and most common).
- Include disabled: if checked, also show the resources that have been disabled (e.g. by Remove Resources or by one of the merge components).
- Filter (optional): can be used to select a subset of resources. See Filters.
- Maximum time: the amount of seconds after which the calculation is interrupted.
The type of statistics calculated depends on Value Type. For example for ‘number’ the average and standard deviation are calculated, but for ‘string’ the longest common prefix is calculated.
Expression returning values determines which values will be inspected. It is executed for each resource (included in the filter). For each resource the expression must return either a single value whose type is in accordance with Value Type, or a list of values whose types are in accordance with Value Type.
For example, if Value Type is number, then the expression must return a number (float or int) or a list of numbers. If the expression returns a list, then each list element is treated separately for calculating the statistics.
Regardless of Value Type, distinct values and their frequency are tracked up to a maximum of Max distinct count. The least common and most common distinct values are reported.
An example. Suppose you have this predicate cost:
| cost |
|---|
| [“124.0”] |
| [“124.0”] |
| [“121.0”] |
| [“128.0”] |
| [“124.0”] |
| [“128.0”] |
Calculating predicate statistics with Expression $$cost and Value Type string reports
| Longest common prefix | 12 |
| Number of distinct values | 3 |
| Number of resources inspected | 6 out of 6 |
| Number of values inspected | 6 |
| Values | ‘124.0’ (3 times = 50.0%), ‘128.0’ (2 times = 33.33%), ‘121.0’ (1 time = 16.67%) |
Doing the same with Expression $cost gives the same result.
Calculating predicate statistics with Expression Float($$cost) and Value Type number reports
| Min | 121 |
| Max | 128 |
| Mean | 124.83333333333333 |
| Standard deviation | 2.4776781245534107 |
| Number of distinct values | 3 |
| Number of resources inspected | 6 out of 6 |
| Number of values inspected | 6 |
| Values | 124.0 (3 times = 50.0%), 128.0 (2 times = 33.33%), 121.0 (1 time = 16.67%) |
Another example. Suppose you have this predicate dates:
| dates |
|---|
| [“2019-12-01”, “2019-12-02”] |
| [“2020-01-01”] |
| [] |
| [“2019-12-02”, “2019-12-03”, “2019-12-02”] |
Calculating predicate statistics with Expression $dates and Value Type string reports
| Longest common prefix | 20 |
| Number of distinct values | 4 |
| Number of resources inspected | 4 out of 4 |
| Number of values inspected | 6 |
| Values | ‘2019-12-02’ (3 times = 50.0%), ‘2019-12-01’ (1 time = 16.67%), ‘2020-01-01’ (1 time = 16.67%), ‘2019-12-03’ (1 time = 16.67%) |
If you want to exclude duplicates within a resource, you can use Expression ListDistinct($dates):
| Longest common prefix | 20 |
| Number of distinct values | 4 |
| Number of resources inspected | 4 out of 4 |
| Number of values inspected | 5 |
| Values | ‘2019-12-02’ (2 times = 40.0%), ‘2019-12-01’ (1 time = 20.0%), ‘2020-01-01’ (1 time = 20.0%), ‘2019-12-03’ (1 time = 20.0%) |
You can get statistics about the years by using Expression Map($dates, _el, StrSubstring(_el, 0, 4)). This gives
| Longest common prefix | 20 |
| Number of distinct values | 2 |
| Number of resources inspected | 4 out of 4 |
| Number of values inspected | 6 |
| Values | ‘2019’ (5 times = 83.33%), ‘2020’ (1 time = 16.67%) |
You can get statistics about the number of dates per resource by using Expression ListSize($dates) with Value Type number:
| Min | 0 |
| Max | 3 |
| Mean | 1.5 |
| Standard deviation | 1.118033988749895 |
| Number of distinct values | 4 |
| Number of resources inspected | 4 out of 4 |
| Number of values inspected | 4 |
| Values | 2 (1 time = 25.0%), 1 (1 time = 25.0%), 0 (1 time = 25.0%), 3 (1 time = 25.0%) |